
Release Notes | September 2025
September 2025
Introducing Managed SSE – Stronger Security, Smoother Experience
We are pleased to announce the availability of our enhanced Managed, Universal Secure Service Edge (SSE), designed to unify SWG, ZTNA, CASB, and FWaaS in one unified agent. By consolidating critical security functions, organizations can simplify management, reduce complexity, and ensure a more consistent user and administrative experience.
Gain Clarity with the New SD-WAN Service Overview
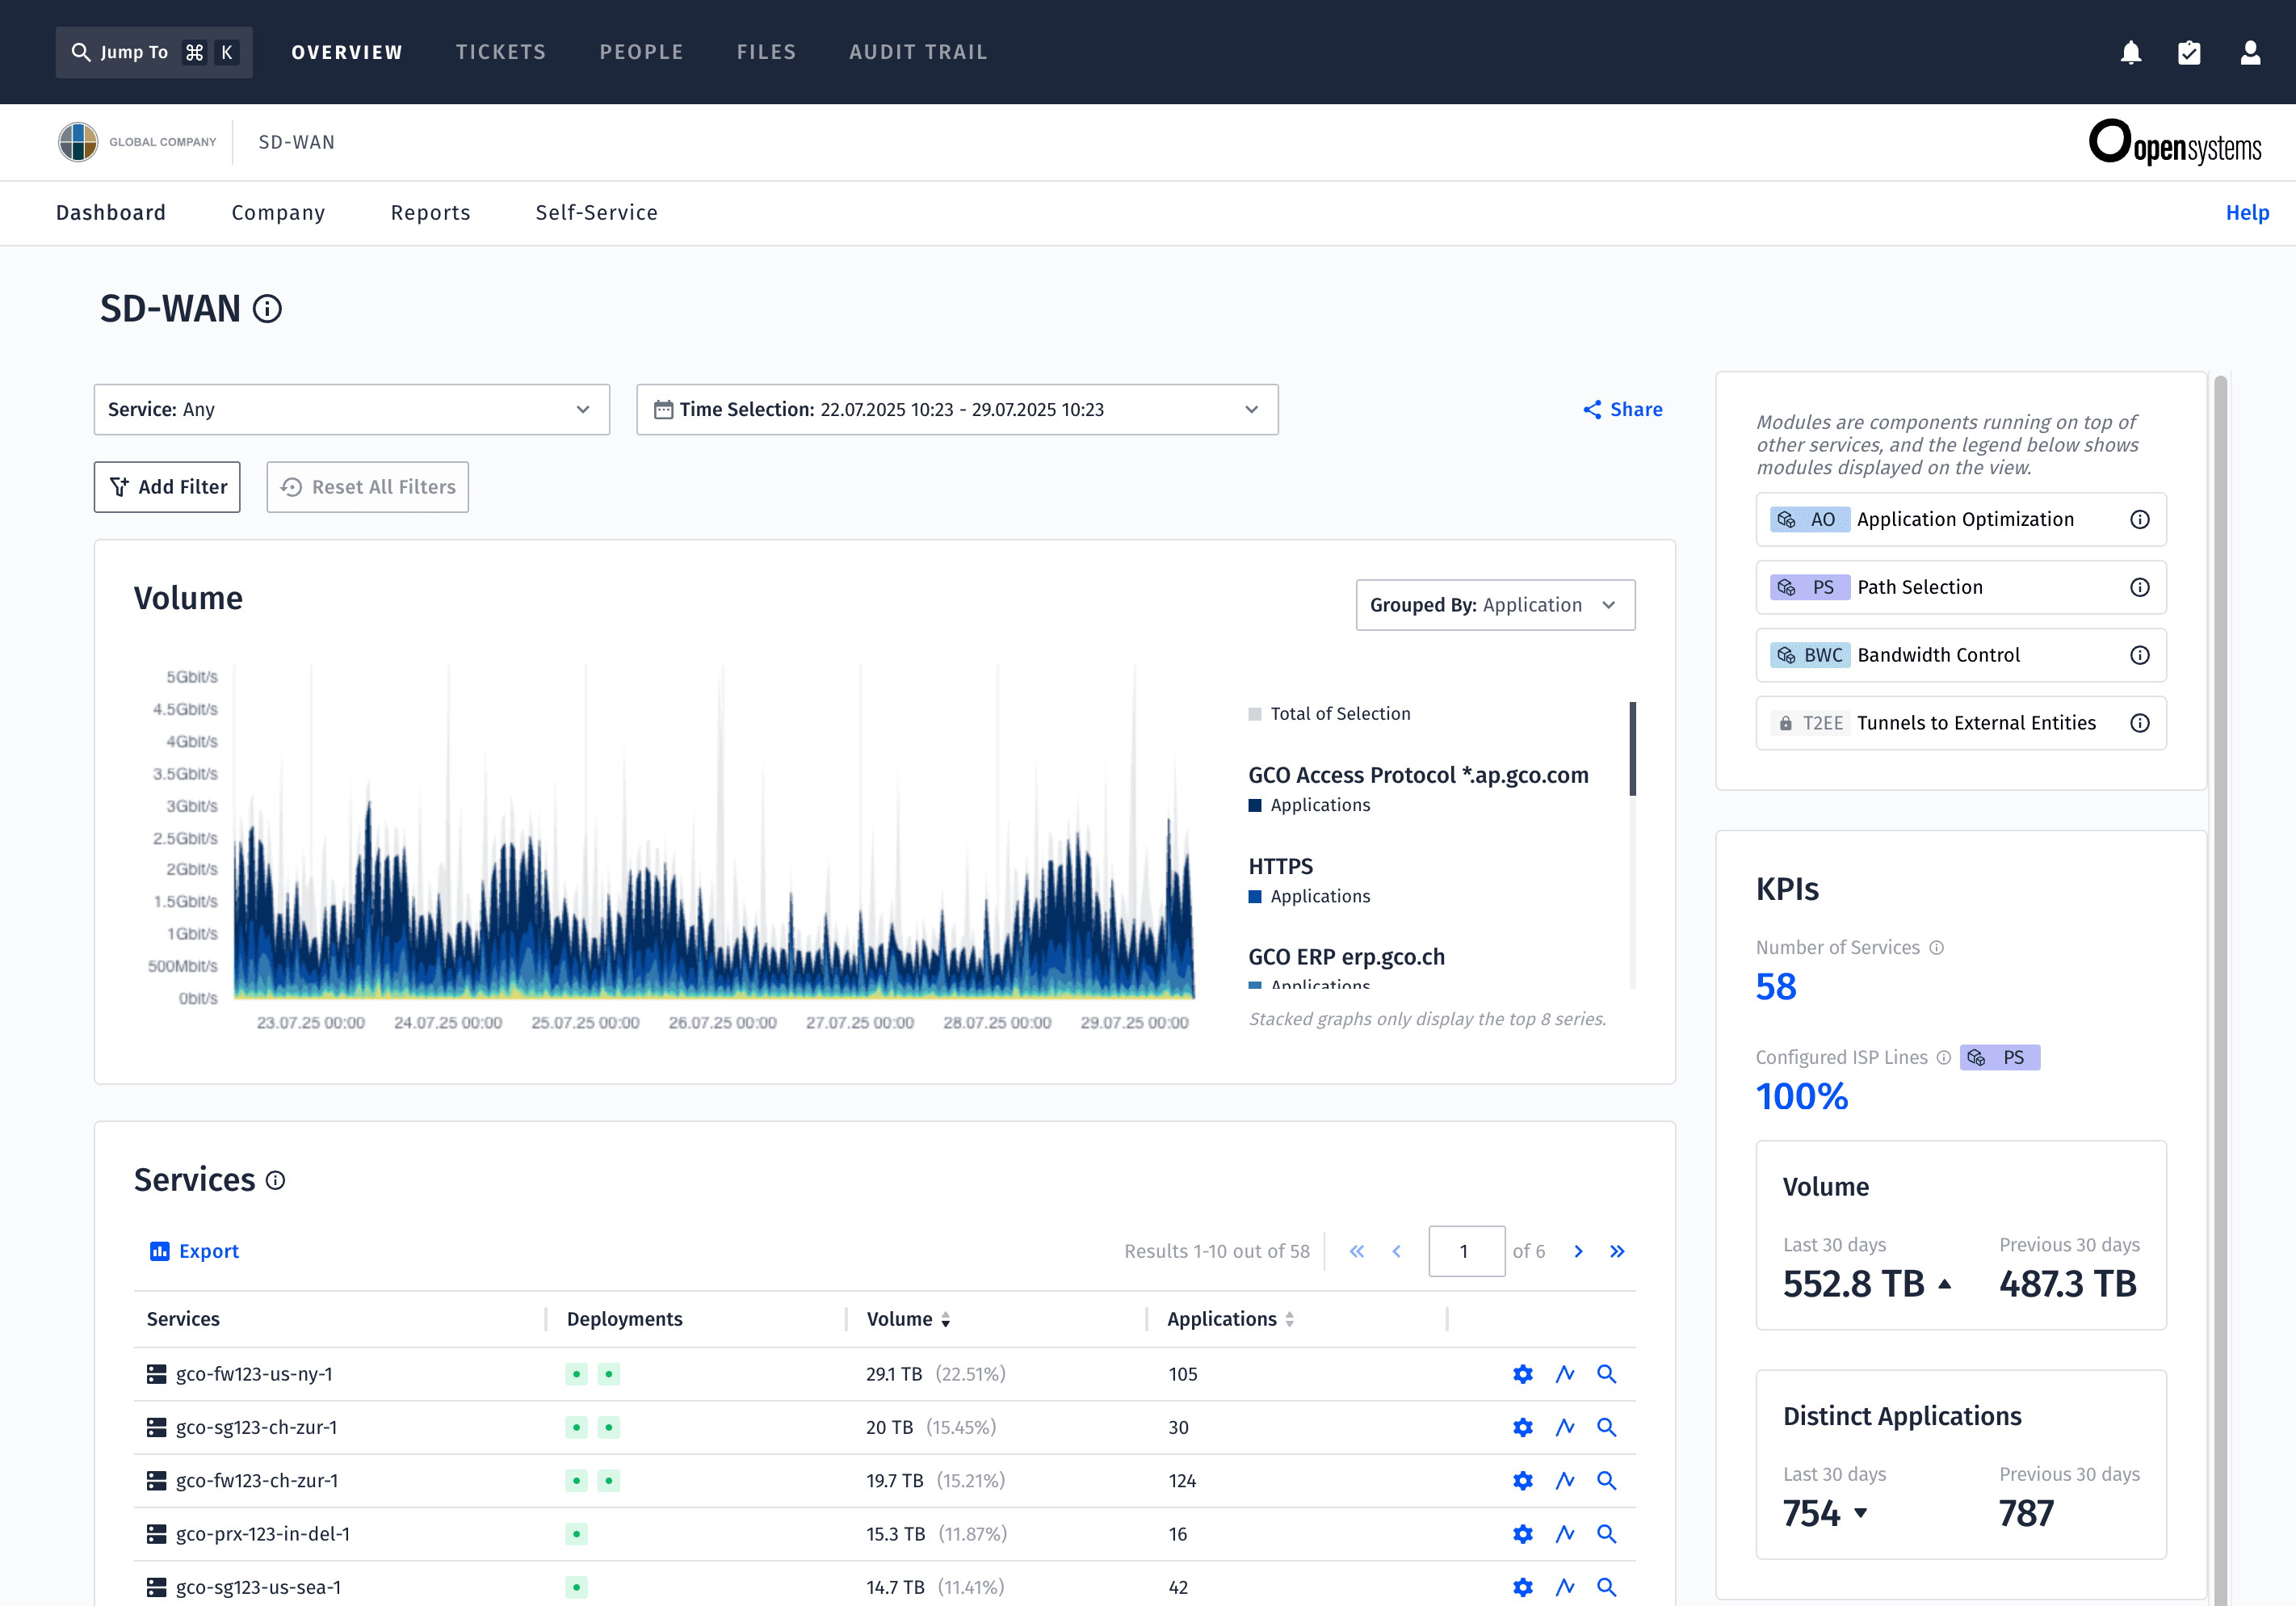
Finding SD-WAN insights used to mean digging through fragmented pages – making it hard to navigate and time-consuming to find what you needed. With the new SD-WAN Service Overview, all key analytics are now in one reliable place.
See how traffic flows, which applications drive usage, how sites perform, and what’s happening at the interface level – all in a single view.
The result: actionable insights that make managing SD-WAN easier and more effective.
Already active for all SD-WAN customers. Just type “SD-WAN” in the Jump-To tool.
–> Find out more about the New SD-WAN Service Overview
Pinpoint Network Issues with New Backbone Performance Metrics
Wondering where performance problems really come from – your site, the Backbone, or the destination? With our new Backbone metrics, you can now see first, middle, and last mile performance at a glance.
Instead of only having end-to-end visibility, you’ll know exactly whether an issue sits in the first mile (your site to the Backbone), the middle mile (across the Backbone), or the last mile (from the Backbone to the destination).
The result: faster troubleshooting, clearer insights, and smoother operations.
Available automatically for all customers using the Backbone – no setup required.
How to get there:
1. Type ‘vpn’ in Jump To and choose ‘VPN Connections’
2. Click on the button ‘Add Filter’ and choose ‘Backbone’ from the dropdown list
3. Select ‘Enabled’
4. Click on ‘Expand All’
Filter Smarter with Logs Explorer Exclusion Mode
Tired of clicking through endless IPs and ports just to exclude a few from your log view? The new Exclusion Mode in Logs Explorer makes it effortless.
Simply switch to Exclude, click the IP or port you don’t need – and it’s gone.
The result: faster, cleaner filtering with fewer clicks.
The feature is already active.
–> Find out more about the Logs Explorer Exclusion Mode
Instantly Spot Traffic Flows with Renewed Host Interfaces Table
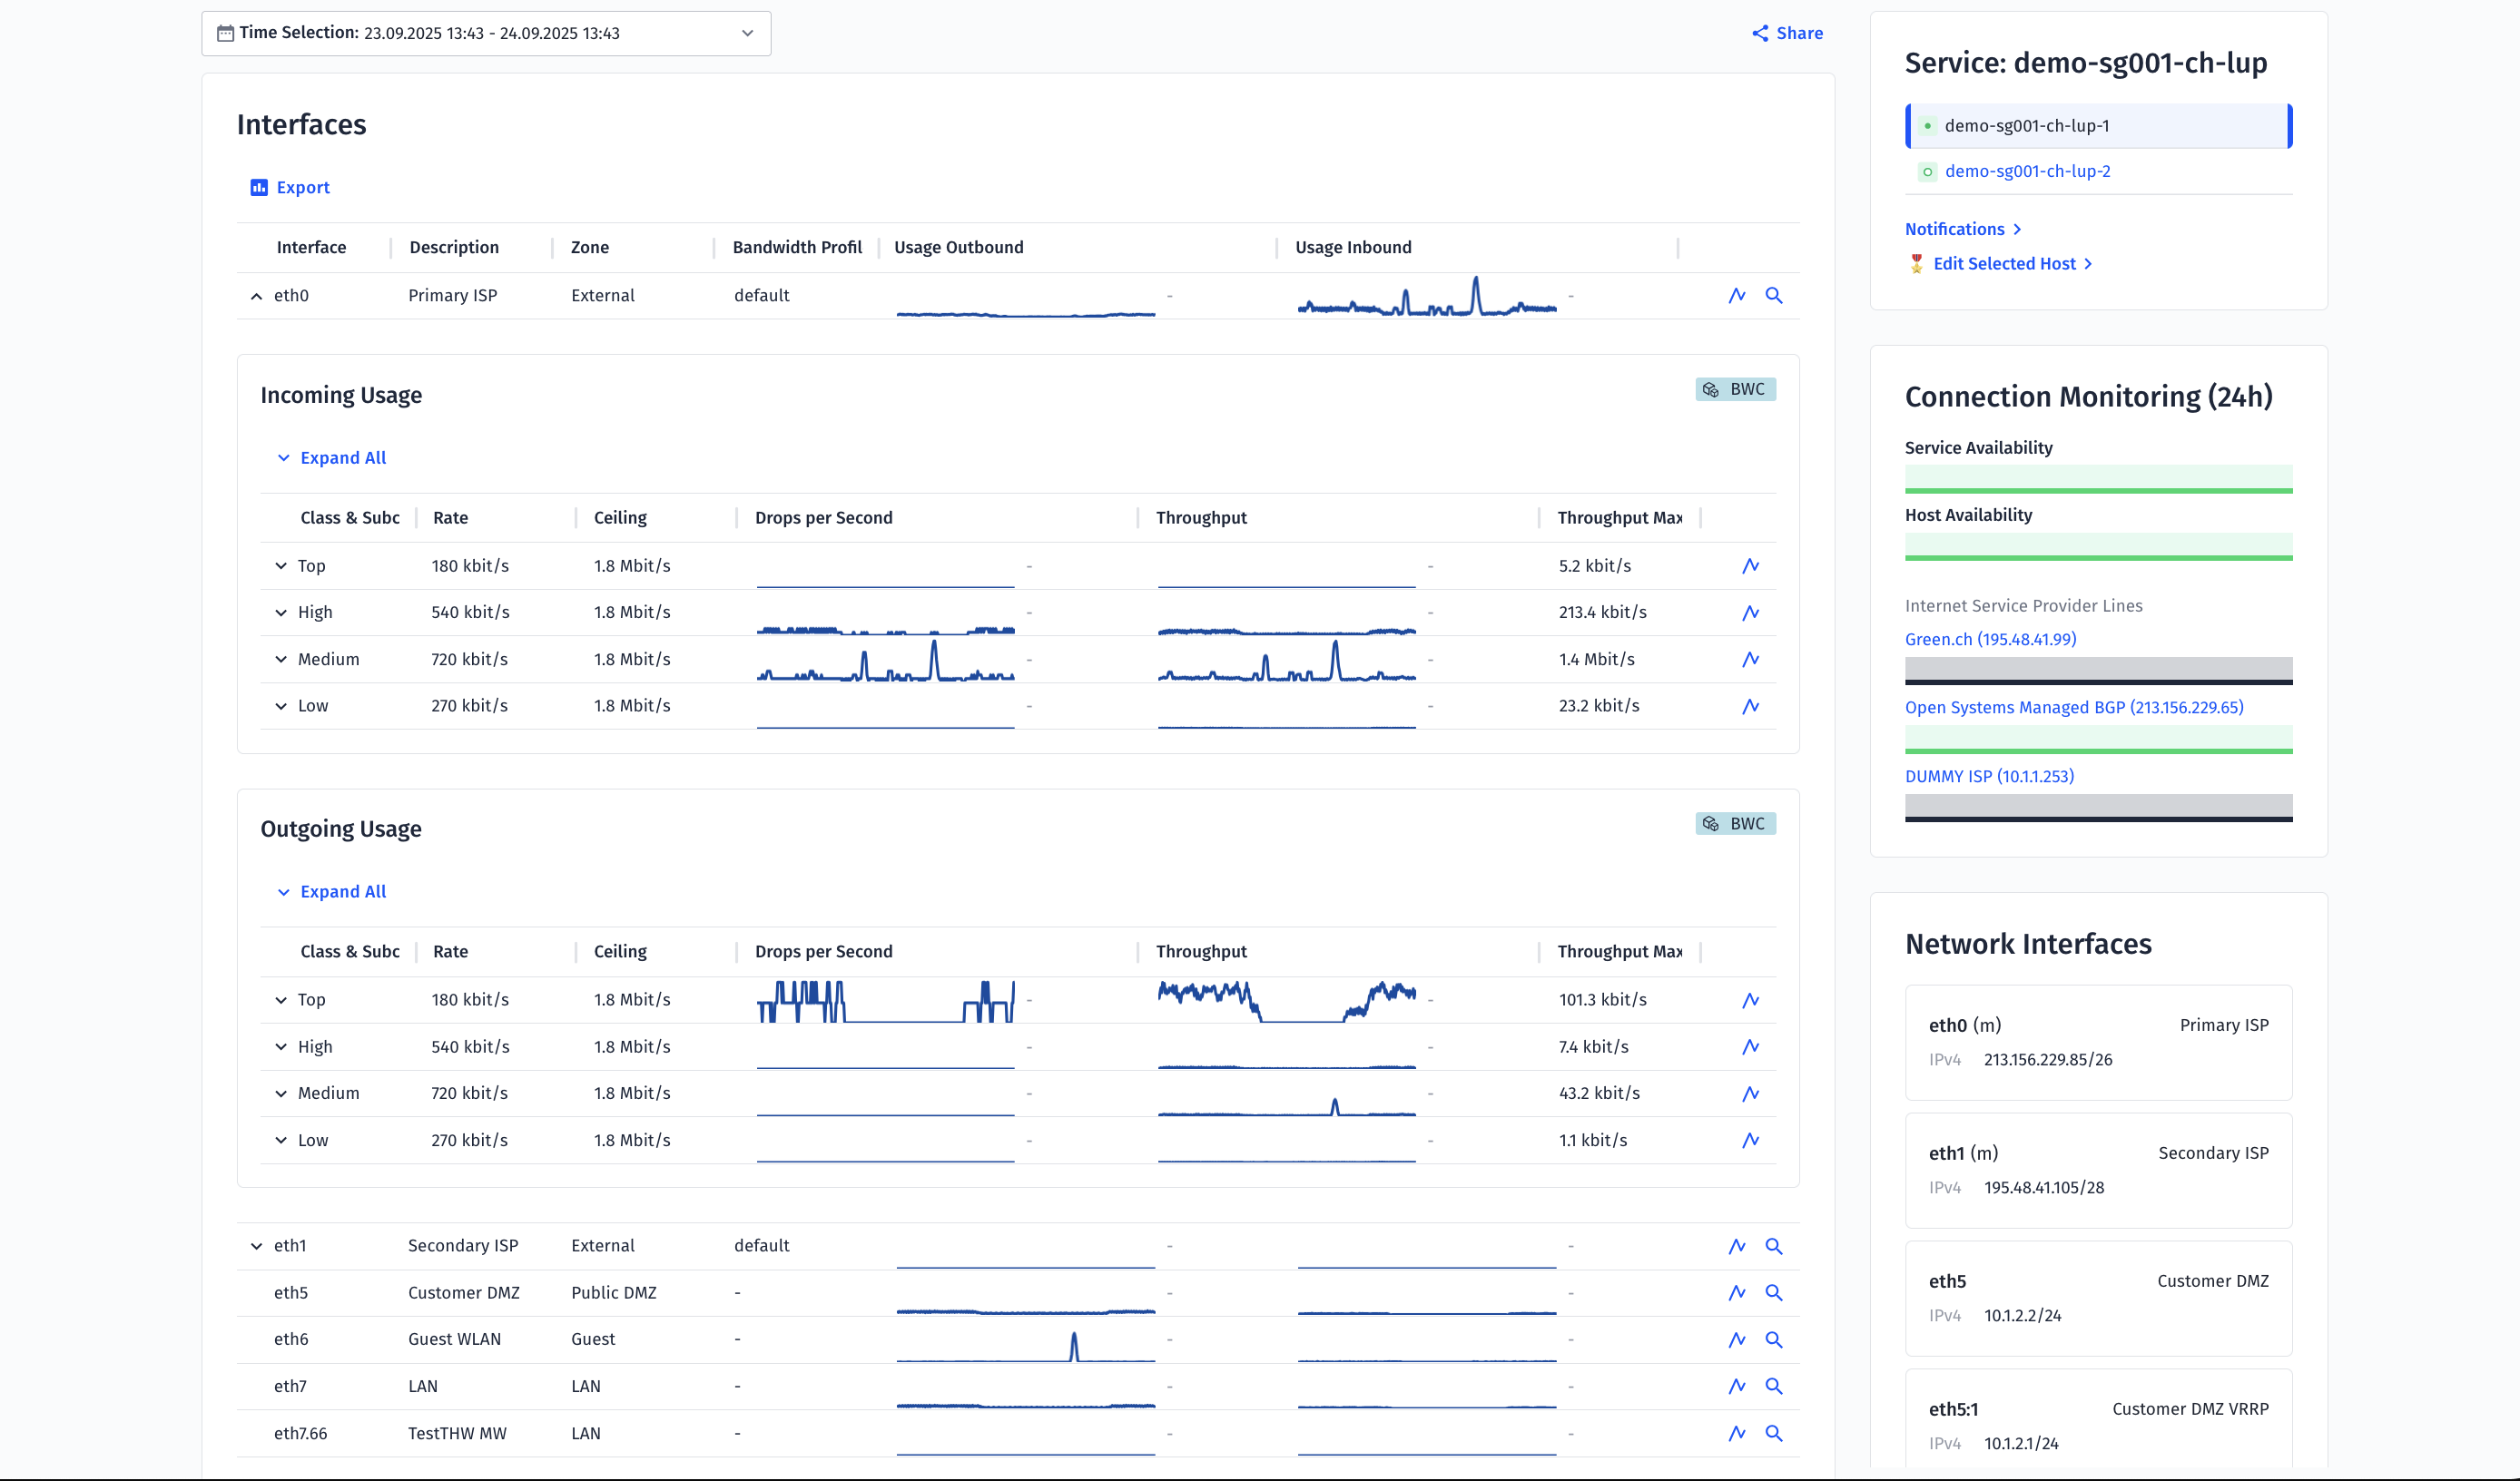
Struggling to see which traffic class is consuming bandwidth – or having to click endlessly to get application details? The renewed Host Interfaces Table now gives you a clear inbound/outbound traffic split at a glance.
The result: faster analysis, easier troubleshooting, and better visibility into potential bottlenecks.
Available automatically – no setup needed.
How to get there:
1. In Jump To type the name of the host you are interested in
2. Click on the tab ‘Infrastructure Statistics’
3. Scroll down to ‘Interfaces’
4. Expand the table rows to see bandwidth control details
Copy Information from Tables in one Click
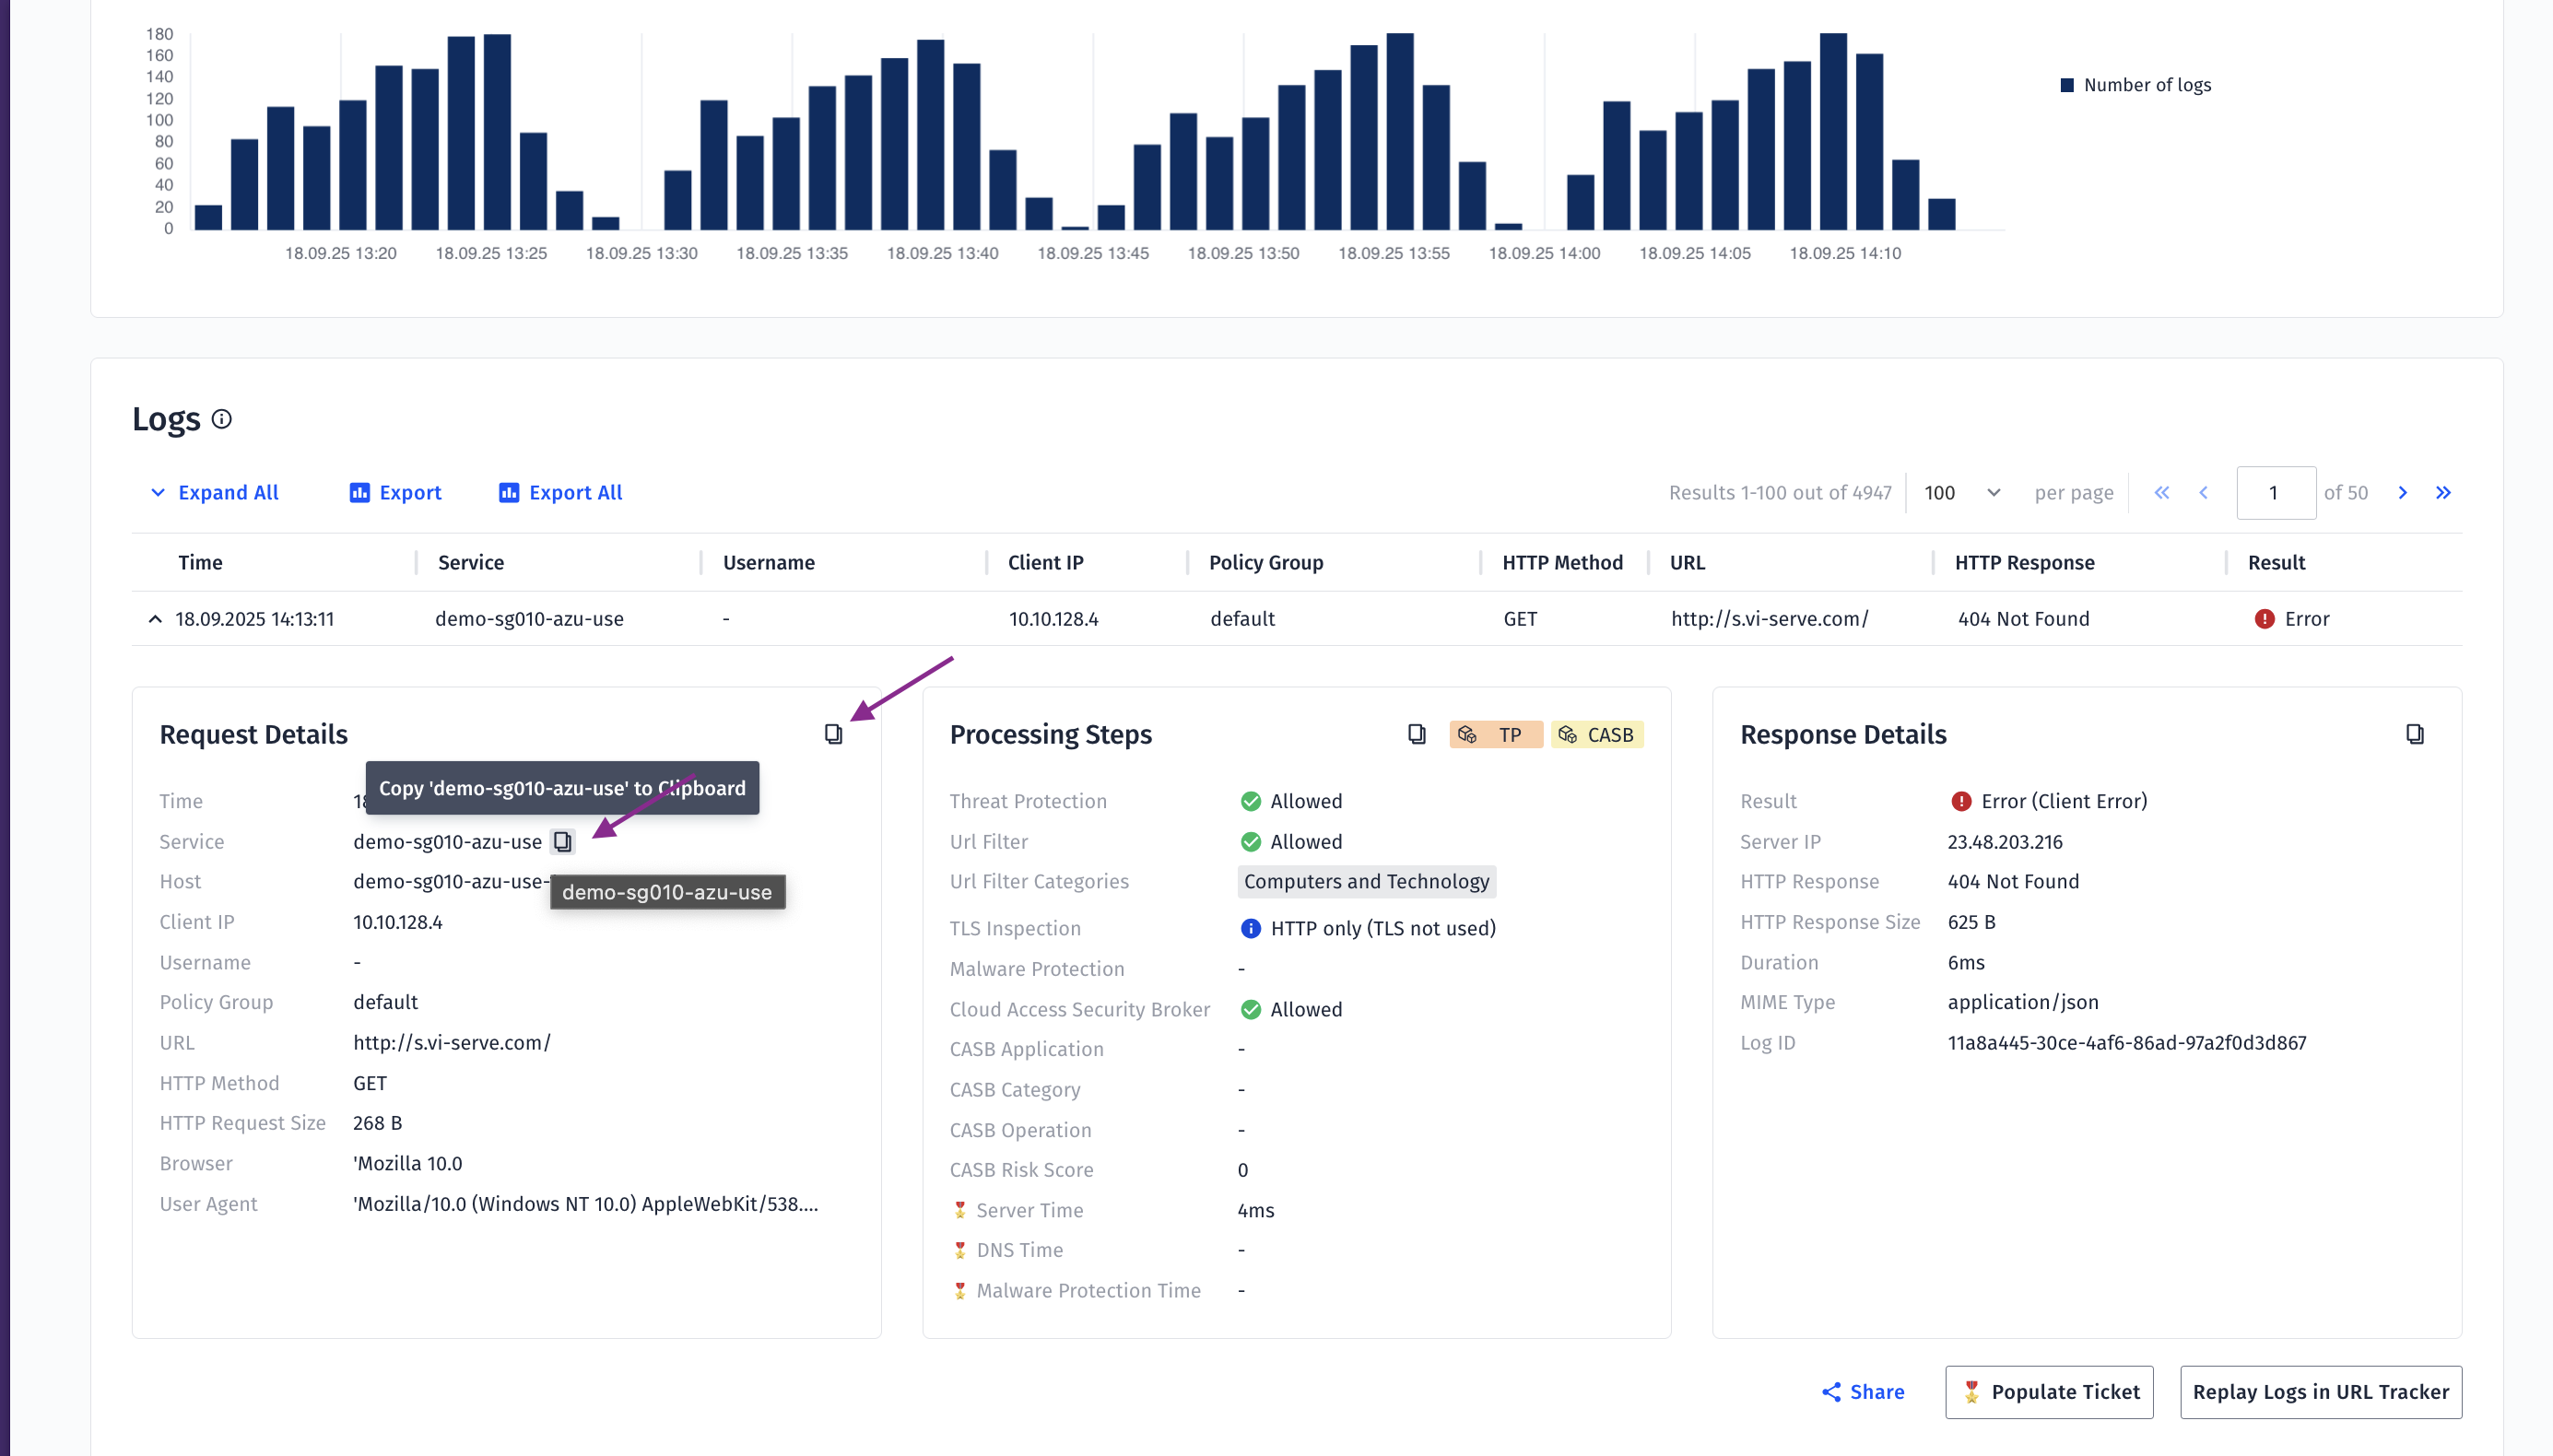
Tired of copying table data field by field? With the new one-click copy function, you can now grab an entire table at once – or just a single field if that’s all you need.
The result: faster, easier data handling with fewer clicks.
Already enabled for everyone – no setup required.
How to get there:
Wherever you see the copy icon just click on it to copy to clipboard. Example:
Customer Stories: Real Success with Open Systems
See how leading companies are using our solutions to simplify operations, gain visibility, and improve performance:
Kelvion – Discover how Kelvion streamlined its network operations with Open Systems.
Read story
Franke – Learn how Franke improved security and performance while reducing complexity.
Read story
Leave Complexity
Behind
To learn how Open Systems SASE Experience can benefit your organization, talk to a specialist today.
Contact Us