
Release Notes | May 2025
May 2025
Improved: Firewall Logs Analysis
The analysis of firewall logs is one of the most powerful troubleshooting functions included in the Mission Control Portal. That’s why we are bringing the analysis functionalities of the firewall logs to the next level:
- See now all the firewall logs of all your firewalls centralized in one place
- We keep the history for ALL logs – not only for permanent logs as previously in the Firewall Log Viewer
- Use the filters to find what you need
Please note: The Firewall Log Viewer was discontinued and is being replaced by the Firewall Logs Explorer.
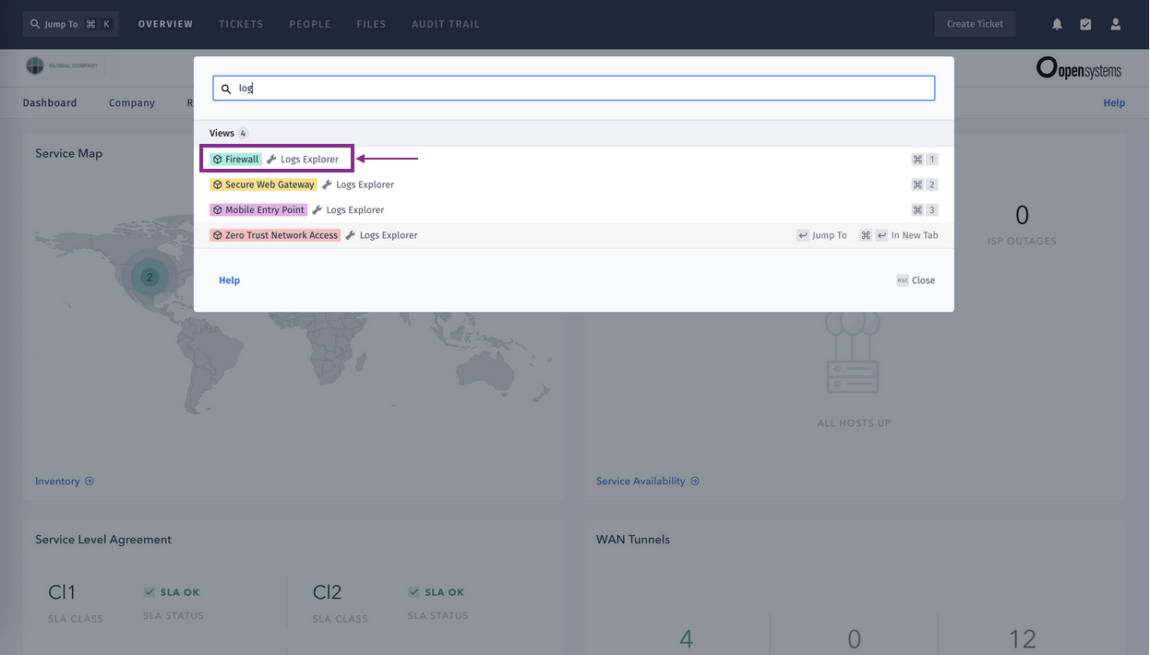
How to get there:
- Open your Mission Control Portal
- Click on “Jump To” in the upper left corner
- Type in “log” and choose “Firewall Logs Explorer” from the results (see screenshot below)
–> Find out more about the Logs Explorer
New: AI category for the Secure Web Gateway
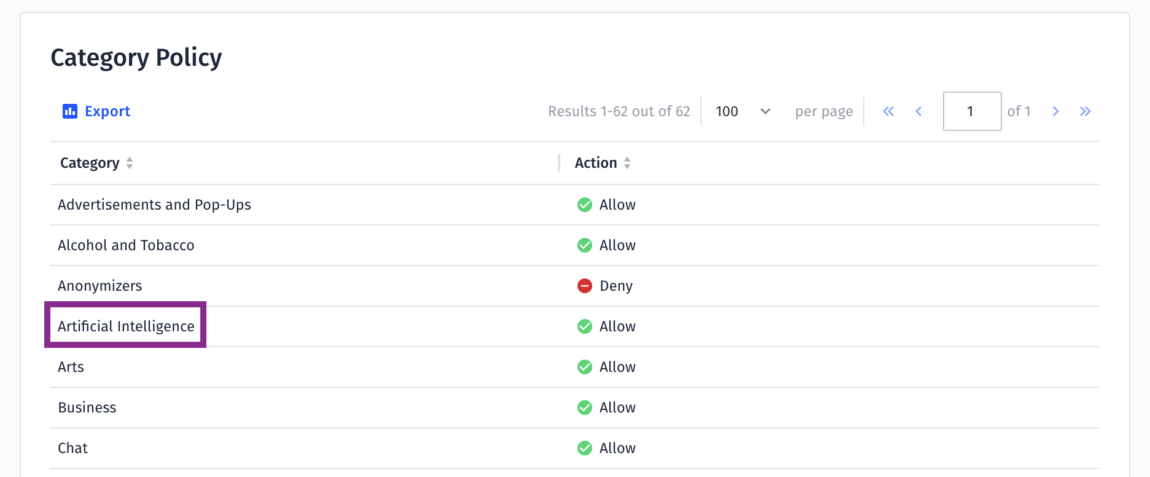
This new category is designed to filter websites that provide artificial intelligence (AI) resources, platforms, applications and AI-driven services. It includes a broad range of AI applications such as chatbots, like ChatGPT, content creation tools for text, images and videos, as well as code generation.
How to get there:
- Open your Mission Control Portal
- Click on “Jump To” in the upper left corner
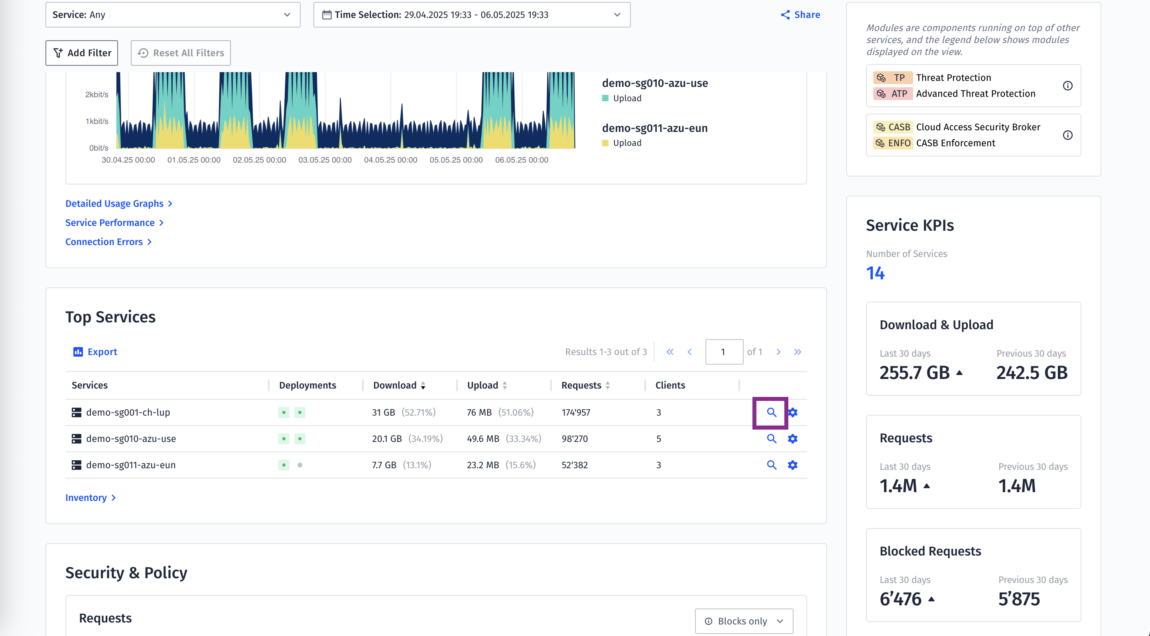
- Type in “Service Overview”. Then select “Secure Web Gateway – Service Overview”.
- Open the Host Information page for one of the services by clicking on the magnifier icon.
- From there, go to Configuration and Tools > Secure Web Gateway > URL Filter > Category Policy.
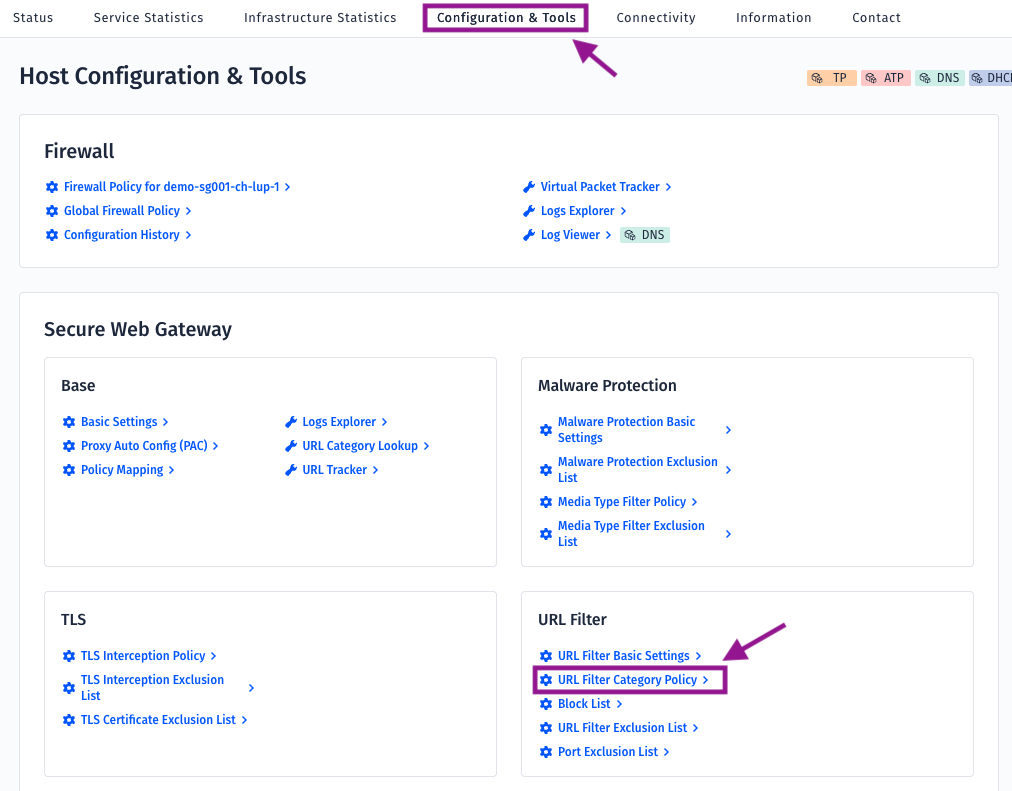
- See the new AI category along with its associated action in the Category Policy section.
- If you want to change the settings please open a ticket for Mission Control.
–> check out our blog article “Enabling the Secure Usage of AI Web Tools”
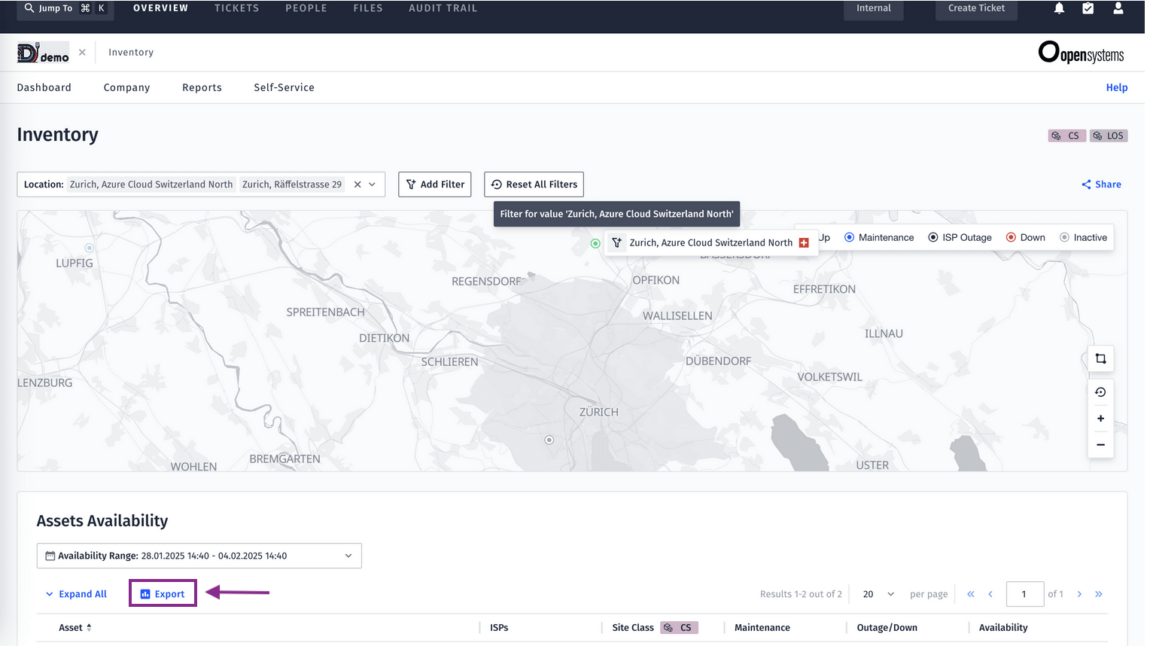
Inventory View .CSV export
You can now export all data from the Inventory View as a .csv file, including detailed information about all ISP lines – more than ever before.
Important:
These new exports will replace the existing ISP Line Overview and ISP Line Availability pages and their associated exports soon! All the data previously found there – and additional new details – is now included in the updated Inventory exports.
How to get there:
- Open your Mission Control Portal
- Click on “Jump To” in the upper left corner
- Type in “Inventory” and click on the result
- Click on “Export” as shown in the screenshot below.
–> find out more about the reports in the Inventory View
Logs API: Get Open Systems logs in your SIEM
For analyses and other tasks, you can easily ship your firewall, ZTNA, Secure Web Gateway, and authentication logs to your SIEM using our Logs API.
How to get this:
Please reach out to your Technical Account Manager if you would like to use the Logs API.
Export of firewall objects now with ‘Members’ column
The export of firewall objects in the Firewall Policy Viewer now includes a ‘Members’ column. This column contains the members that a firewall object has. It can also help you to e.g. find out which objects contain the IP 10.2.3.4.
Remember that you can activate the firewall self-service functionalities for create, edit, and delete objects.
How to get there:
- Open your Mission Control Portal
- Click on “Jump To” in the upper left corner
- Type in “Firewall”. Then select “Firewall Policy”.
- Click on “Export” as shown in the screenshot below
(if you don’t see it click on the “Show sidebar” button).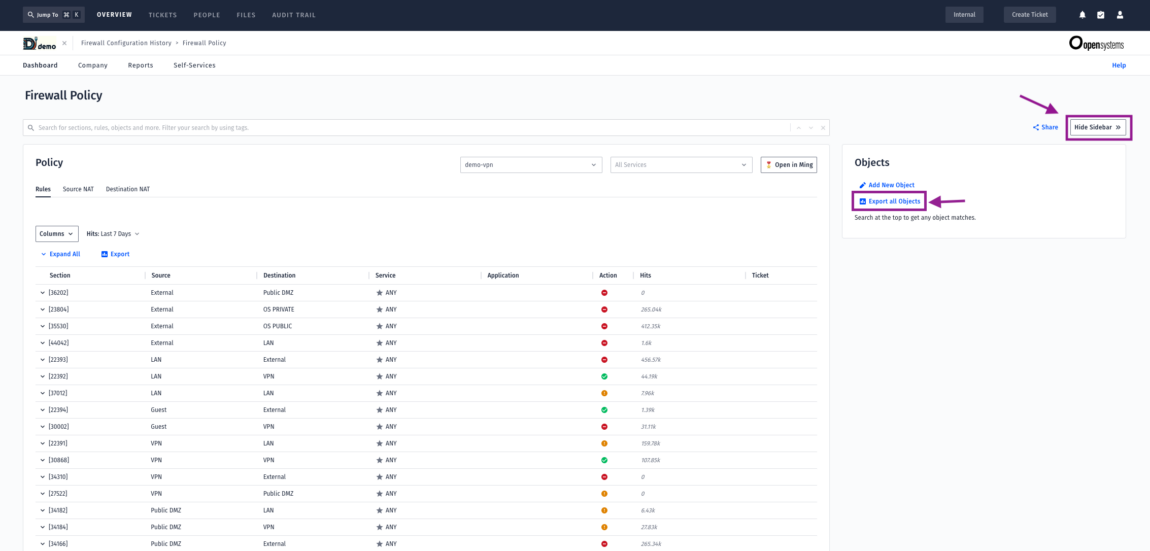
–> Check out the Firewall Editor Guide
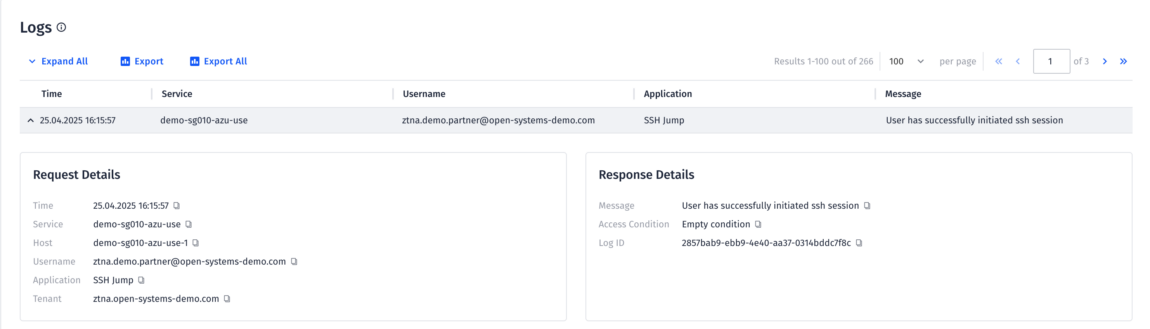
ZTNA tools in Mission Control Portal
The ZTNA Service Overview gives you an overview of how ZTNA is used in your organization: You can see all accesses to the applications over time, users access, or top services. Everything is powered by the Service Overview functionality.
Additionally, the ZTNA Logs Explorer provides detailed logs of user interactions with applications, helping you troubleshoot issues or verify that the service is functioning as expected.
How to get there:
- Open your Mission Control Portal
- Click on “Jump To” in the upper left corner
- Type in “Service Overview” and you will see all the Service Overviews available to you.
- Or type in ‘Logs Explorer’ and you will see all the Logs Explorers available to you.
Leave Complexity
Behind
To learn how Open Systems SASE Experience can benefit your organization, talk to a specialist today.
Contact Us