
From Minutes to Seconds – The Engineering Behind Smarter Alerts
 Fabian Kohn, Senior Systems Engineer
Alerting is one of the unsung areas in IT where excellence usually stays invisible. It’s when everything is running so smoothly that nobody notices what it actually takes to do it well. Whenever alerts fire correctly, they maintain trust; quietly and subtly. But if they misfire, they create noise, confusion, and ultimately “alert fatigue”. At Open Systems, where some 10,000 globally distributed deployments feed into a unified observability platform, getting the alerting right is not just a technical requirement: It is a promise to our customers.
This promise is backed by something few (if any) SASE providers can claim: A unified platform that integrates every service, every signal and every alert – built on deep service expertise and end-to-end engineering.
This is the story of how the engineers in my team uncovered a nuanced design challenge in Prometheus AlertManager, then reframed the problem and swiftly delivered pragmatic, high-impact improvements.
What AlertManager Does – And Why It Matters in a Unified Platform
In our observability pipeline, AlertManager acts as one of the critical decision points where incoming signals converge. Metrics pour in continuously from our services, incoming log messages are transformed into numerical indicators, and rules created by service teams govern what constitutes a meaningful signal.
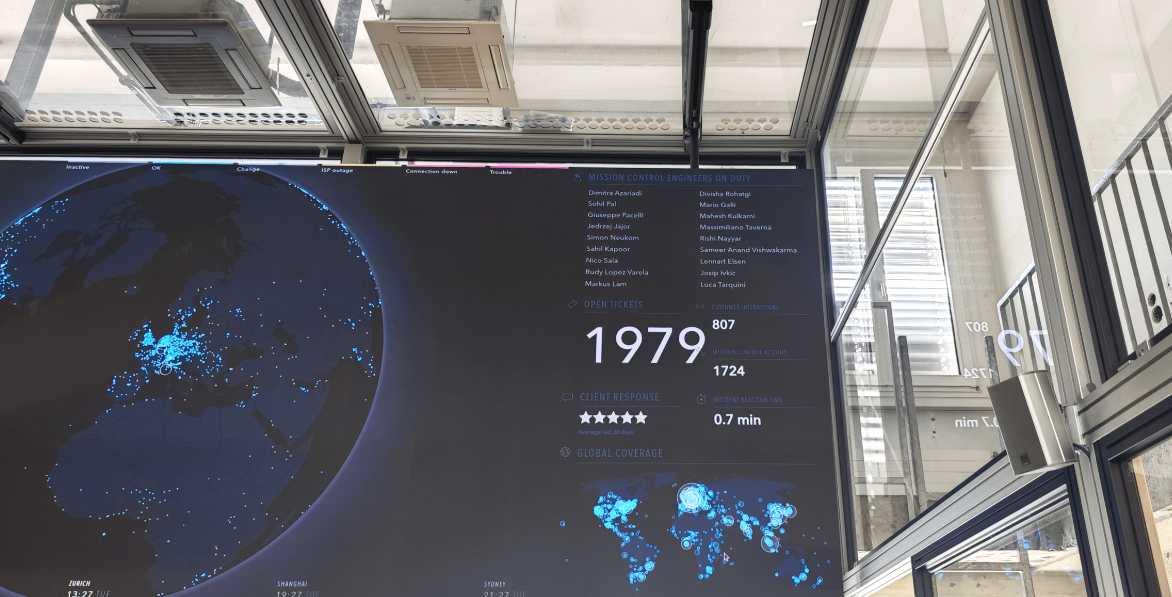
Suppose a deployment shows a high CPU load sustained over time. The service team responsible for that system knows exactly what “high” means in context, and they encode this knowledge into alert rules. AlertManager evaluates these rules in real time and decides whether to just log this event to an alert queue, nudge an engineering team via a messaging app or – in more serious situations – raise a customer-visible event in a ticket which is taken care of by our expert-level support: Mission Control, 24×7.
Because these alerting rules come from professionals who have years of experience in building and operating their services, each alert reflects genuine intent. And because everything is integrated into a unified platform, those alerts can be aggregated, deduplicated and contextualized across thousands of deployments. The result is actionable information across the digital noise.
This approach is unusual in the SASE industry, where monitoring is often at infrastructure level, generic or bolted on. At Open Systems, monitoring and alerting are built at the source, by the people who know the services best. I feel it’s a fundamental differentiator, and one that becomes essential at the scale we’re dealing with.
When a Design Assumption Meets Real-World Scale
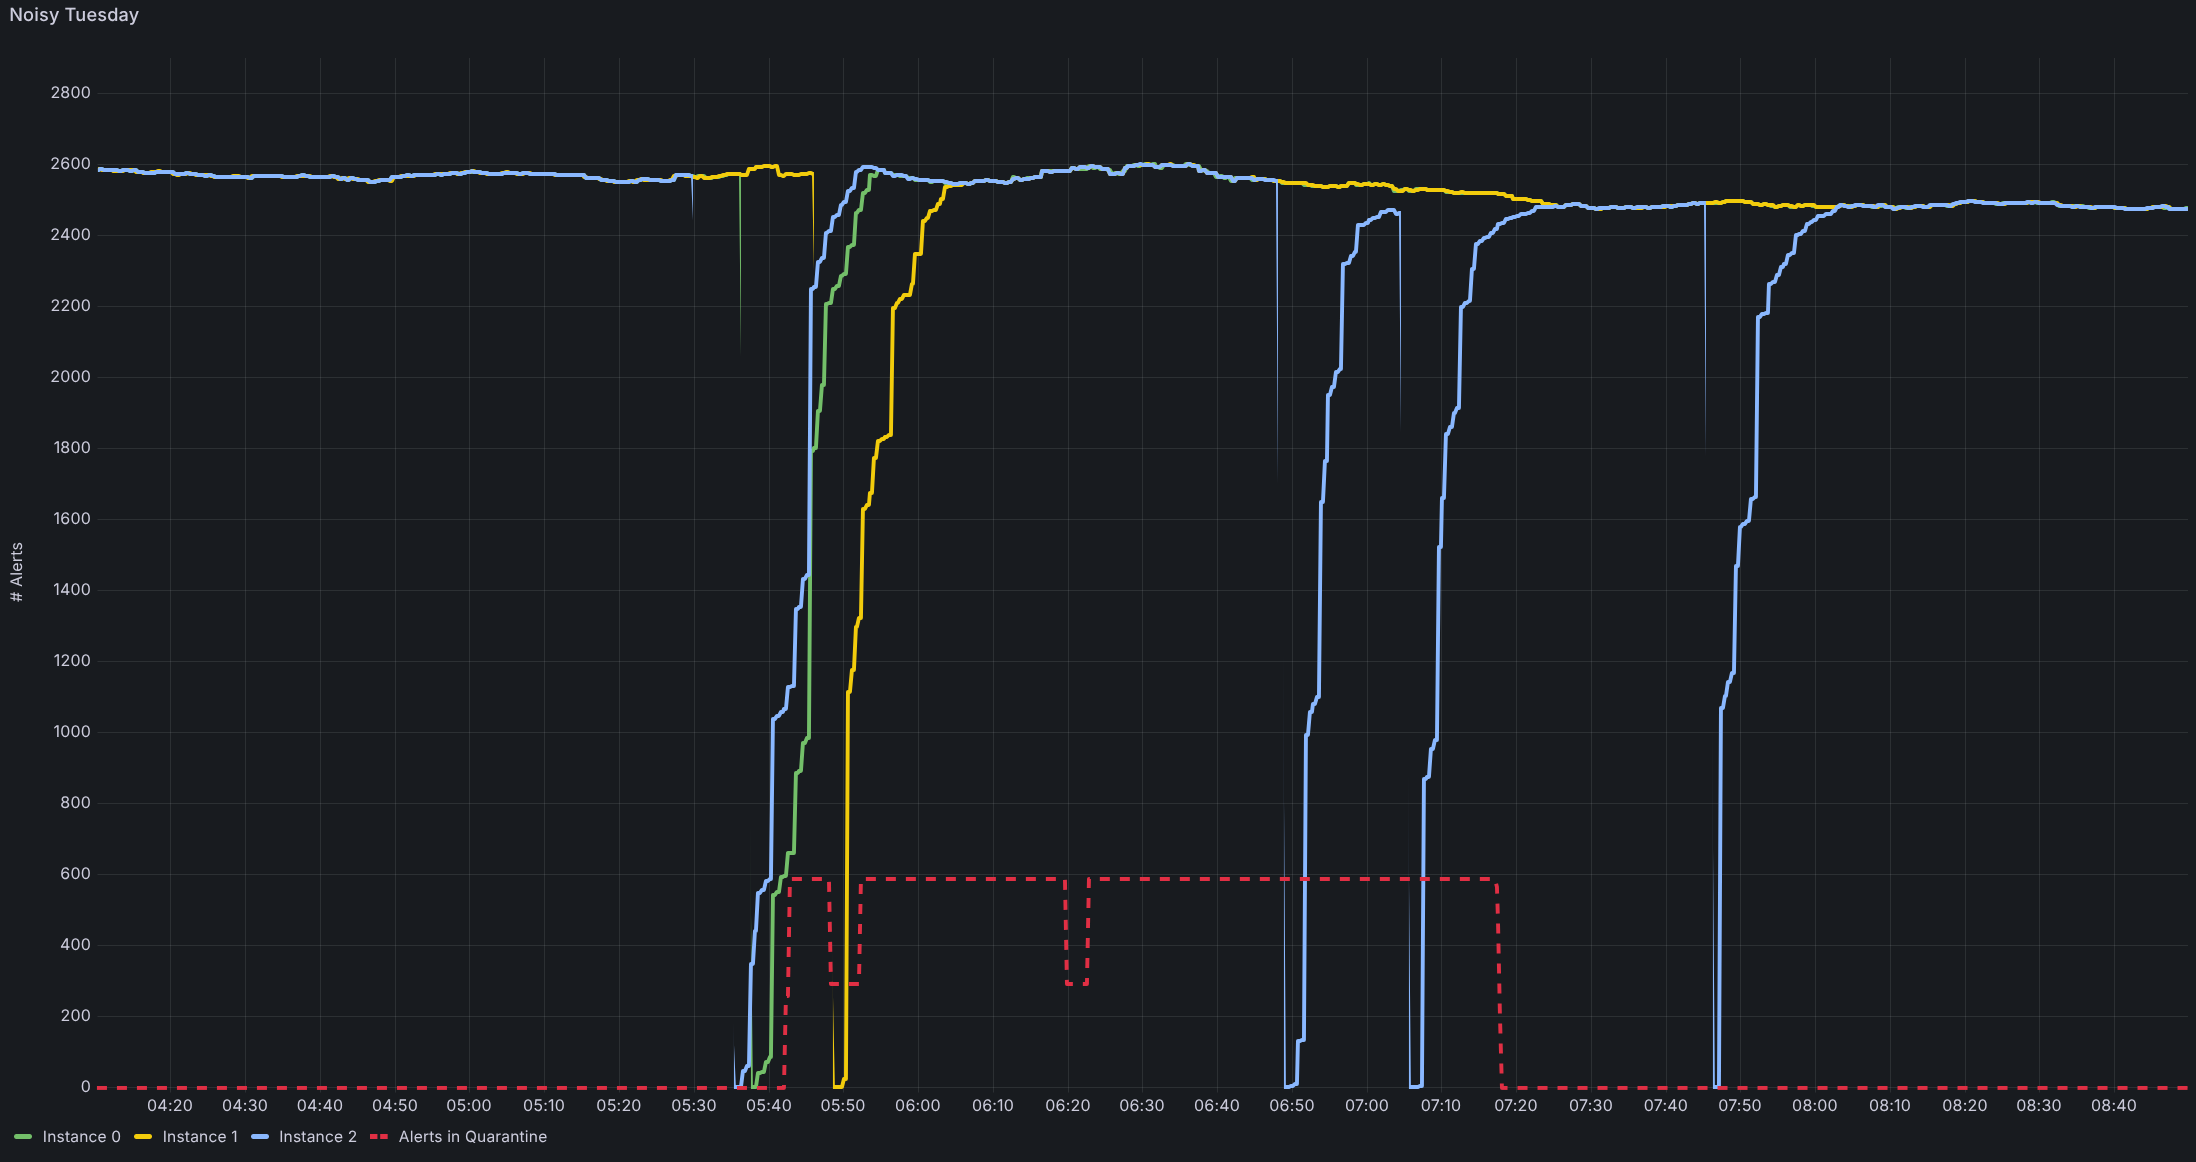
Most of the time, AlertManager served us reliably. At some point, however, a recurring behavior pattern emerged, almost always on Tuesdays. We noticed that during routine restarts of our monitoring and alerting infrastructure, Mission Control would suddenly be flooded with ticket events. Sometimes hundreds of them, sometimes thousands. Some were visible to customers, and some were not.
From a customer’s point of view, those numbers represented a tidal wave of incidents. Yet internally, the systems were healthy. It was clear that we needed to follow this up. The real issue turned out to be more nuanced: whenever AlertManager restarted, it temporarily lost its internal state that tracks which alerts are currently firing. This “amnesia” isn’t a bug – it’s part of AlertManager’s design philosophy.
AlertManager assumes:
- The environment load is relatively small.
- Alerting signals arrive continuously and hence are available quickly after restart.
- In a typical environment, with few signals and a simpler pipeline, this temporary forgetfulness is not problematic. Signals come back quickly, and the state usually rebuilds within seconds, if not quicker.
But Open Systems stretches those assumptions:
- Our signal volume is enormous; vastly higher than in most AlertManager deployments.
- Our alerts drive customer-visible events; which means misfires are unacceptable.
- Our stack is deeply interconnected; many components contribute to final state reconstruction.
Together, these factors produced a tipping point for AlertManager. Reconstituting the “status quo” after a restart took minutes instead of seconds. And during those minutes, AlertManager did the only cautious thing it could: it refired notifications.
One engineer described the effect succinctly: “It wasn’t malfunctioning. It was doing exactly what it was designed to do – just not what we needed it to do.”
Recognizing that distinction was the breakthrough.
Mindset Shift – From Tuning to Understanding
As a first mitigation step, the team introduced a new component to the alerting pipeline: The Alert Quarantine – a rather simple heuristic that helps identify floods of events not rooted in an actual problem and prevents the underlying alerts from translating into customer-visible tickets. This allowed us to immediately improve the situation for customers while giving us time to analyze the root cause.
Our next reaction was to start tuning things: tweak intervals, modify timers, adjust gossip parameters. But nothing significantly improved the situation. The Tuesday storms persisted.
Then the team shifted its approach. Rather than attempting to force AlertManager to deviate from its designed behavior, they revisited its assumptions, trying to understand the root cause. They realized the real problem wasn’t a misconfiguration; it was a mismatch between design intent and operational reality.
A colleague of mine still remembers the aha moment inspired by a comment in an upstream GitHub issue: “AlertManager does not guarantee exactly-once notifications.”
For dashboards or small setups, that isn’t an issue. But when your alerts trigger Mission Control ticket events – and sometimes SMS notifications to an IT director – “exactly once” matters a lot.
The team stopped trying to fix a bug that didn’t exist and started designing a workaround rooted in real-world constraints.
A Pragmatic, Elegant Solution – The Snapshot Approach
A breakthrough prototype emerged during an internal hackathon. An AI-assisted coding session produced a full database backend that stored the entire alert state persistently. It was creative and functional, but far too cumbersome for production.
Introducing a permanent database would add operational complexity and new failure modes. AlertManager wasn’t designed to rely on a database to track its state, so adding one would violate one of our guiding principles: As much as necessary, and as little as possible.
Instead of introducing a database, the team distilled the solution to its essence, in just a few lines of code:
- When AlertManager shuts down, write a complete snapshot of its alerting state to a lightweight persistent volume.
- When it restarts, reload that snapshot immediately, restoring the state almost instantaneously.
This snapshot-based approach gave AlertManager exactly what was missing – memory – without changing its underlying design philosophy. No redesign. No extra infrastructure. Just the right amount of persistence at the right moment.
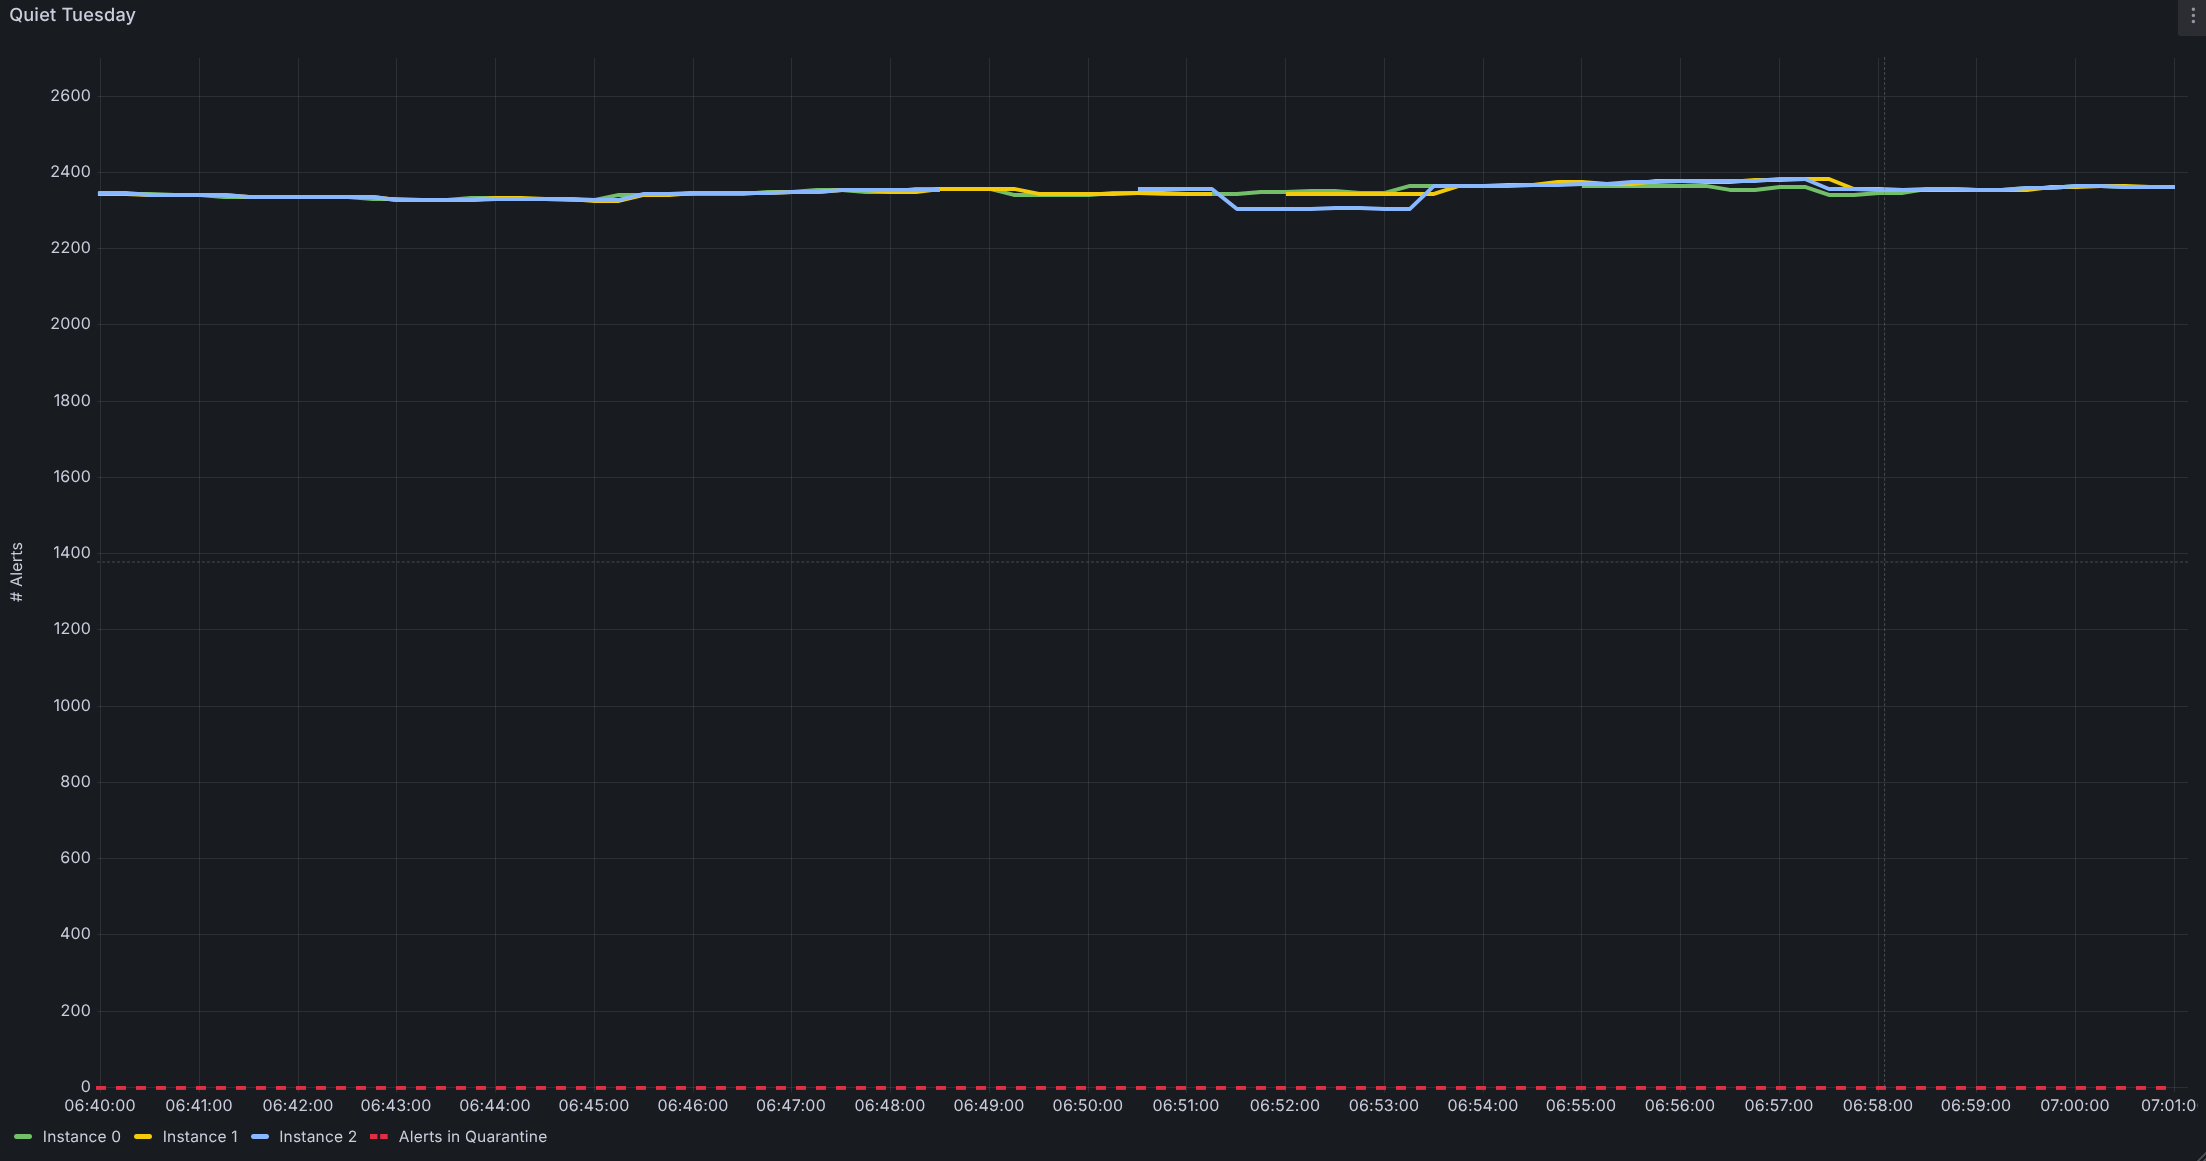
As a result, the startup time dropped from several minutes to well under 30 seconds – the threshold below which refiring never begins. And the Tuesday floods disappeared instantly.
The Outcome – Cleaner Alerts, Restored Trust and a Stronger Platform
The impact was immediate.
Mission Control no longer sees bursts of duplicate ticket events whenever AlertManager is restarted. Teams no longer spend time on avoidable escalations or unnecessary post-mortems. And customers who subscribe to alert notifications now experience fewer false positives and clearer, more actionable signals on every day of the week, including Tuesdays.
Just as importantly, engineers regained trust in the alerting pipeline. The system now behaves consistently, predictably and respectfully: exactly what you want from a platform entrusted with detecting issues across thousands of distributed deployments.
This work also resonated outside Open Systems. After our colleague’s conference presentation, multiple attendees mentioned they faced similar issues but assumed they were alone out there. Seeing our solution validated their experiences and sparked deeper conversations in the observability community.
The Bigger Picture – Why Open Systems Excels Where Others Struggle
This engineering story reveals something fundamental about our platform.
It’s not an accident that we ran into AlertManager’s design boundaries. Most vendors never will – because most vendors don’t operate with this level of signal volume, service diversity, or customer-integrated automation.
Open Systems’ approach is unique because:
- Each service team defines its own logic for alert rules using deep domain expertise.
- Our unified platform brings all these signals together into one coherent observability system.
- Alerts carry meaningful intent rather than generic thresholds, even notifying customers to take action.
- The system scales to more than 10,000 deployments across the globe, providing SASE services to different industries.
I reckon this is why our monitoring and alerting capabilities go beyond what other SASE providers can offer. When everything is integrated – from service design to platform logic to customer notification – the result is an observability experience that is accurate, dependable and actionable at scale.
The snapshot solution is just one example of how deeply our engineers understand their systems, and how far they go to preserve the trust our customers place in us.
Accurate Alerting and Beyond
Effective alert management requires precision, humility, and an engineering culture that looks beyond symptoms to understand root causes.
My team’s work on AlertManager shows exactly that, illustrating the kind of craftsmanship and pragmatism that define our platform, and that differentiates Open Systems in an industry where monitoring often remains an afterthought.
Great alerting doesn’t happen accidentally. It happens because people care enough to shape it to be like that.
Leave Complexity
Behind
To learn how Open Systems SASE Experience can benefit your organization, talk to a specialist today.
Contact Us