
Clarity at Scale
 Aron Karpati, Software Engineer
In the tech blog article Telemetry to Tickets, our colleague described how Open Systems transforms telemetry into actionable insights based on observability. This means collecting signals across services, standardizing them, and turning them into something people can act on.
Our team specializes in logs and metrics, which is where the observability framework becomes tangible. That’s because logs and metrics form the execution layer and hence are part of everyday operations. Customers need logs and metrics for debugging; service teams use them to get insights and innovate; and Open Systems Mission Control finds them helpful in resolving issues.
Turning Haystacks into Clarity
Every system generates data. The Open Systems managed firewalls alone can produce more than 13 terabytes of logs in a single day. Now add metrics such as CPU temperatures, bandwidth throughput, and authentication counts, and the result becomes a torrent of raw information.
In the past, debugging meant opening log files on a machine and manually scanning for the one line that explained why a user couldn’t access a service. It was frustrating for both customers and Mission Control, as well as being time-consuming, and in critical moments, far too slow.
We set out to change that. Our goal was simple: take the overwhelming data bulk in hand and make it consumable – for everyone.
Standardized Observability in Action
Our approach builds on the observability framework, with a focus on consistency and usability.
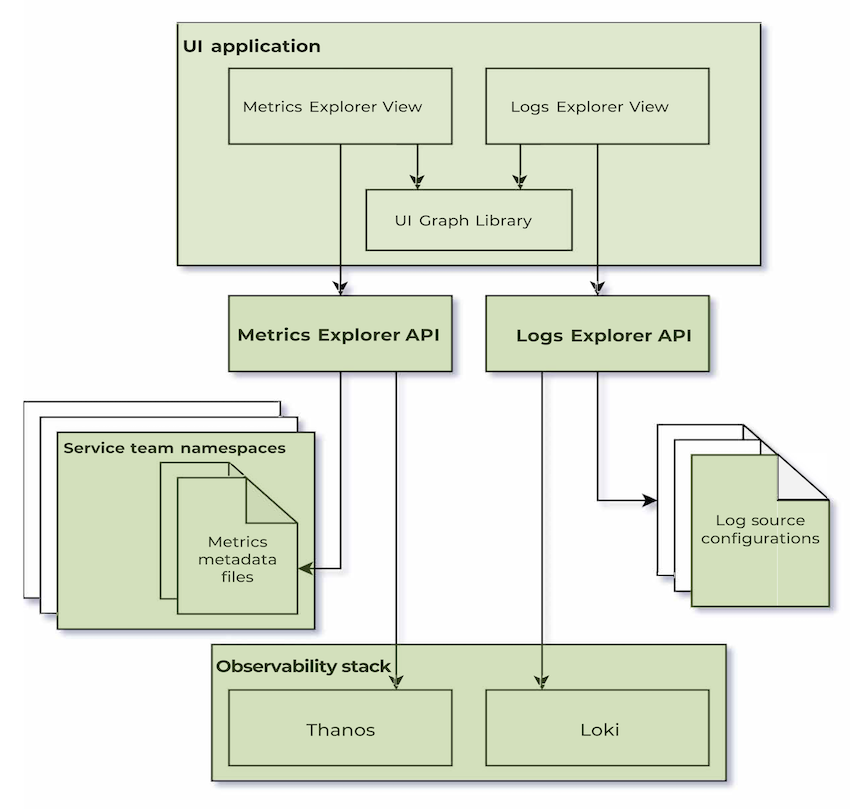
- Metadata files automatically capture business logic from a multitude of configuration files into a single source of truth. For example, CPU temperature readings can be combined into a single KPI that matters for service health. Metadata files are also an input for optimal graph choice and unit standardization, to name but a few.
- Log source configurations specify how to find specific log lines within the observability stack, as well as the permissions required to view the given logs. In some instances, they strip down verbose metadata, surfacing only the most relevant fields.
- Unified Logs, Metrics API and Dedicated Frontend Library provide APIs that get, process, and visualize these new types of data-rich metrics in under five minutes.
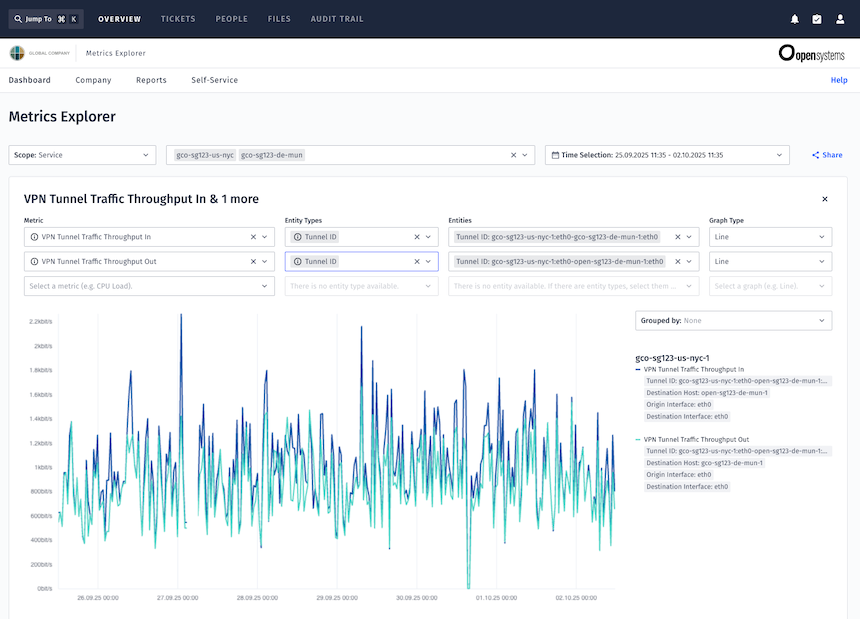
- Metrics Explorer delivers ready-to-use graphs for trend analysis, capacity planning, and anomaly detection.
- Logs Explorer lets customers switch seamlessly between historic log analysis and live streaming, supporting both long-term investigations and real-time debugging.
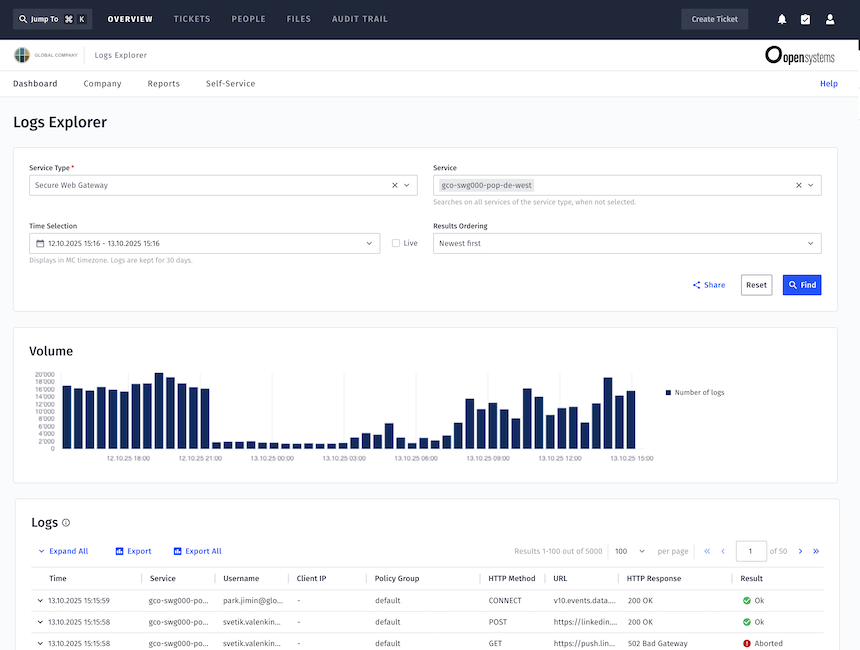
The impact of this design is tangible. When the team integrated firewall logs into Logs Explorer, the work was completed in a single day – something that previously took weeks of engineering.
On Scale and Security
Handling data at this scale demanded smart solutions. We introduced:
- Chunk loading – splitting queries into two-hour chunks to avoid timeouts.
- Asynchronous retrieval – ensuring that partial results appear even if some chunks fail.
- Optimized filtering – simple queries (like “all logs from a service”) return instantly, while still supporting complex searches.
Security is just as important. Logs can contain sensitive data, so strict authorization ensures users see only what they are entitled to. The system has been hardened through external penetration testing – a reflection of its importance as core security infrastructure.
Customer Impact
For customers, these changes have been transformative. In fact, we’ve noticed that logs and metrics have become two of the most used tools in the Open Systems customer portal:
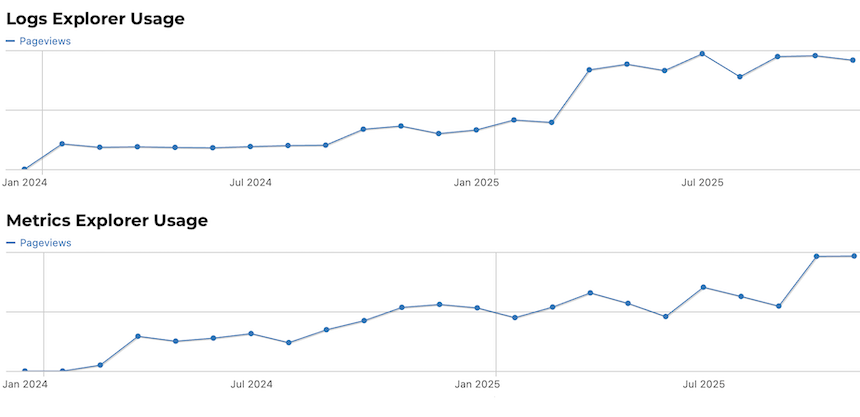
- Logs Explorer is now the most used debugging tool – more than any other portal feature.
- Metrics Explorer has seen its usage double in the past year, and growth continues steadily.
The feedback speaks for itself. One customer shared, “The old firewall log viewer was my least favorite tool in the Portal. You cannot imagine how happy I was when I went to search for firewall logs, and I found the new Logs Explorer. It is definitely an improvement – I can now find what I need so much faster.”
Others point to the new capabilities as highlights of their daily work. The ability to filter Secure Web Gateway logs by multiple services at once, for example, has made it far easier to spot patterns and diagnose issues across a broader set of data. The redesigned Firewall Logs Explorer and its more intuitive interface were also considered clear improvements.
We’ve seen that beyond specific features, the real change lies in how customers work. They can now trace a user’s journey across firewall, proxy, and authentication events, discovering exactly where access broke down. They can stream logs live as they test a new firewall rule, watching in real time how it behaves. They can even use the explorers to check on external providers – for example, verifying whether an ISP is delivering as promised. And when new metrics or log sources are added by service teams, customers benefit immediately, without waiting for releases or incurring extra costs.
For many, it feels like pulling back the curtain on their infrastructure. What was once hidden behind support tickets and guesswork is now transparent, fast, and at their fingertips.
Benefits for Mission Control and Engineering Teams
Internally, the transformation is just as significant. Mission Control engineers no longer need to dive into raw host logs to investigate incidents. Instead, they rely on the same tools as customers, enabling them to resolve tickets faster and work more collaboratively with the people experiencing the issue.
For service teams in engineering, the benefits are structural. Because everything is built on consistent APIs and schemas, integrating new services into the observability framework no longer means building custom log viewers from scratch. It’s like adding a simple configuration. This consistency reduces engineering overhead and frees teams to focus on innovation – creating new features, smarter dashboards, or AI-assisted analysis, rather than reinventing the basic structures.
Most importantly, everyone is aligned around a single source of truth. Customers, Mission Control, and engineering teams all work from the same data, with the same interfaces, and the same vocabulary. That alignment reduces friction, builds trust, and accelerates decision-making.
Why Logs and Metrics Matter
Logs and metrics might sound fiddly and technical, but their impact is practical, wide-reaching and immediate:
- Reduced downtime through faster problem resolution.
- Customer autonomy through powerful self-service.
- Consistency and trust from a single source of truth.
- Scalability and flexibility to add new data sources quickly.
Where competitors often deliver fragmented experiences, forcing teams to juggle different tools and query languages, Open Systems offers standardized explorers. That means fewer steps between detection and resolution, less cognitive load in critical moments, and more time for teams to focus on what really matters.
Looking Ahead
We’ve come a long way from static PNG graphs and manual log searches. Today, Metrics Explorer and Logs Explorer process terabytes of data daily, giving customers intuitive ways to troubleshoot and engineers a common platform to innovate.
Next on the horizon are AI-assisted analysis, and even deeper cross-service integrations to better deal with high-volume, high-cardinality data. The mission remains the same: to give customers and Mission Control the clarity they need to keep networks secure, resilient, and open.
Leave Complexity
Behind
To learn how Open Systems SASE Experience can benefit your organization, talk to a specialist today.
Contact Us