
From Telemetry to Tickets: Our Ongoing Journey to Observability
 Joel Verezhak, Principal Systems Engineer
Running security and connectivity at global scale means chasing issues that rarely announce themselves. Instead, they whisper through subtle patterns: a slightly higher reject rate, a sudden rise in VPN logins, a fleet-wide CPU spike.
A few years ago, we handled these signals one by one. It worked – until it didn’t. Incidents were reconstructed after the fact, and broader issues often slipped past unnoticed. Today, by collecting and analyzing signals from roughly 10,000 edge devices centrally, we catch problems earlier and see the system more clearly.
This article is the story of that shift – from classical monitoring to observability. I’ll share the changes we made, how they improved life for both customers and engineers, and where the journey takes us next.
Goal of Observability: Quickly Identify and Diagnose Failures
Observability is often described as the modern evolution of monitoring. Traditional monitoring meant collecting logs and metrics from machines, building dashboards guided by past incidents, and watching for known failure patterns. This works well when history repeats itself – but the moment something unexpected happens, those dashboards may offer little help. Root-cause analysis often starts from scratch with every new incident.
Observability takes a different approach. Instead of pre-wiring checks for known failures, it gives you the ability to ask new questions of your system in the moment. By correlating across multiple signals (logs, metrics, and traces) you can explore and “play” with the data to uncover what’s really happening.
The goal of observability is simple: when an incident occurs, quickly determine what changed and what went wrong. At Open Systems, our focus is on improving observability maturity so we can reduce mean time to resolve (MTTR), by lowering the mean time to detect (MTTD) and diagnose issues.
We think of observability as the mathematical dual to controllability. To illustrate: consider an oven. We can control the internal state by using the dial to set the temperature. To understand the oven’s internal state, we must observe a property of the system, in this case, reading the thermometer.
Now scale that idea to a web application with a frontend, backend, and database. The system can drift into all manner of weird and wonderful states, and as an engineer you may only see that “a user clicked something, and it broke.” Observability asks: Can you reconstruct the system’s state from the data you collect? If not, the system isn’t truly observable – and the solution is to improve the quality of the data you gather.
Origins of the Observability Team
Our push for observability wasn’t about chasing a trend. It came out of necessity. As we led the organizational shift to the cloud, we needed a solution that could span edge, on-prem, and virtual deployments. Complexity was piling up: SASE blurred the line between networking and security, hybrid work multiplied the number of edges, and third-party dependencies were shifting beneath our feet like rugs. As modern systems rely on so many external factors, an application that ran smoothly yesterday could crash today with no obvious cause.
That’s when observability became critical. By comparing today’s data with yesterday’s and slicing it across dimensions, we could follow the thread back to the root cause and understand why the system was in this state.
At Mission Control (our 24×7 Operations Center) however, engineers were still working tickets case by case. They’d see a device at a site with an issue but miss the fact that the same problem was playing out at other sites or even across continents. Local troubleshooting hid global patterns. Centralized analysis unlocked far more power from the data, and it quickly became clear that shrinking detection and diagnosis time would be the key to faster resolution.
We needed a way to understand the system’s state from the outside – to reconstruct change using signals that fuel intuition. Internally, we framed it as the dual of controllability: if configuration changes are how we act on the system, telemetry must be how we read it truthfully. And if we couldn’t, we knew we had to collect better signals.
The First Success: Semantic Conventions
Our first big step was adopting OpenTelemetry (OTel), an open-source standard for collecting and transmitting telemetry data (logs, metrics, and traces) in a consistent, vendor-neutral way. At first glance, OTel looked like plumbing: pipelines and data flows for moving telemetry around. But then the power of semantic conventions clicked.
There are only two hard things in Computer Science: cache invalidation and naming things.
– Phil Karlton
The boring-sounding parts, such as consistently named labels for hosts, services, IP addresses, and HTTP status codes, turned out to be the most liberating. With community consensus behind them, engineers no longer had to invent their own naming schemes when instrumenting applications. Correlations became easier, and attributes like http.response.status_code carry a clear, documented meaning without debate.
Once we standardized on OpenTelemetry instrumentation and semantic conventions, the next step was shipping this data. The OpenTelemetry Collector provided the answer: a vendor-neutral agent that runs on bare metal, virtual machines, or Kubernetes (a container orchestration system for automating software deployments), and supports custom components written in Go. That flexibility allows us to plug in domain-specific processors and build core telemetry pipelines around them.
The impact was immediate. We set up a central telemetry gateway in Kubernetes and replaced a zoo of specialized log-scraping agents across our edge devices with a single Collector process, unifying the pipeline, reducing complexity, and giving us a platform we could evolve.
Logs, Traces – And the “Aha” Moment
In the early days of OTel at Open Systems, nothing flowed. The pipes were there, but empty. We started cautiously.
The first migrations were restricted to Kubernetes: logs and traces moved to OTLP (metrics are another story, described below). This was relatively low risk: if we broke something, we’d inconvenience colleagues, not customers. With that confidence, we tentatively began swapping out telemetry agents on customer-facing edge devices, starting with syslogs. These weren’t business critical, but for the first time we were touching functionality tied to alerting.
Once the pipeline held up under that load, we went for two “big bang” moves: proxy logs, shortly followed by firewall logs. Overnight, the volume of data shot up roughly tenfold. Suddenly, nearly all of our log data flowed through OpenTelemetry – centrally, consistently, and at scale. That was the real “Aha” moment: we could query the fleet as one, instead of hopping from device to device, and Kubernetes autoscaling kept the gateway humming as load spiked.
Traces were different. They were new, and by default they flowed through OpenTelemetry from day one. Technically they were straightforward; the real shift was organizational. Teams had to instrument their code, but once they saw the payoff, adoption snowballed. A mundane HTTP 500 that once looked like a frontend glitch was now revealed, via a trace, as a database timeout three services deep.
One particularly rewarding example of organizational adoption has come from our Frontend Team. In the past, simply describing a problem or bug was cumbersome, and could require multiple exchanges: open this page, click that, send us a screen grab. Nowadays? The team simply asks for the trace ID – which is present on every page of our customer portal – of the failed request. Usually, the problem is identified within minutes, and a fix is forthcoming soon after.
Metrics: The High Mountain Pass
On our journey, metrics proved to be the most delicate terrain – a high mountain pass where every step demands care. Metrics are effectively an API for developers: a single name or label change can cascade into broken dashboards, false floods of alerts, and lost trust across the company.
Metrics underpin alerts, service-level objectives (SLOs), and customer-facing dashboards, so stability matters. Our stack spans both legacy and modern backends, and the Prometheus (flat) versus OpenTelemetry (nested) data models didn’t always align. To navigate this pass, we set one rule: preserve names and label cardinality during cutover, or don’t cut over yet. That discipline kept dashboards stable and alerts meaningful, even as we modernized the systems underneath.
Fortunately, the ecosystem is catching up. Prometheus now supports native OTLP ingestion, and OTel-Prometheus bridges have matured. The road ahead is clearer than it was when we started.
Mission Control: What Changed
Customer benefits caught up quickly with the internal experience. Before, an engineer would pick up a ticket and go deep on a single site. Now the first move is often to step back: Is this pattern happening anywhere else? A single fleet-wide query can surface a wave before the fifth similar ticket arrives.

The ergonomics improved, too. Instead of trawling through raw logs, engineers explore hypotheses such as, “This error rate looks scary – has it actually changed?” Pull the history, compare today to yesterday, and avoid false alarms and red herrings. The global view has become a daily companion.
As one colleague put it after a long shift, “It’s abso-f*%&|ng-lutely awesome! I’ll totally use it every time I’m in Mission Control.”
We blushed – and kept building.
What’s Next for Customers
As we keep unifying signals and sharpening correlations, our goal is to shorten the time from first hint to confirmed cause. In practice, that means faster MTTD and reduced MTTR over time – fewer minutes spent guessing, faster return to business as usual.
We’re also shaping proactive notifications. When we see a cross-customer, global phenomenon – a DNS path that’s wobbling across regions, or a wave of VPN login impersonation attempts – the aim is to alert with the appropriate reach and recommend mitigations. When something is specific to a single customer, say a latency drift on one site, or a temperature spike caused by malfunctioning air-conditioning, the aim is a focused heads-up with the context that accelerates the fix. Think of it as early, evidence-backed coaching rather than after-the-fact forensics.And there’s a quieter ambition: fewer false alarms. With more history and better semantics, we can distinguish weekly patterns from true anomalies – helping teams spend their energy on what actually changed.
An Example That Captures the Point
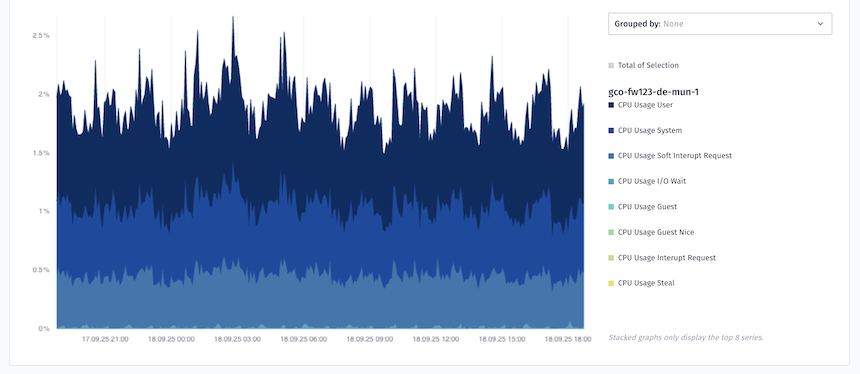
One afternoon, a firewall graph flared. A spike in rejected packets suggested trouble – but a spike on a graph is just an aggregate view, not a diagnosis.
In the old world, the next step was guesswork: dig through device logs, hunt for patterns, slice by IP, service, or port, and hope the hunch was right. Logs are verbose, and even when distributed traces were available, context was scattered and hard to piece together.
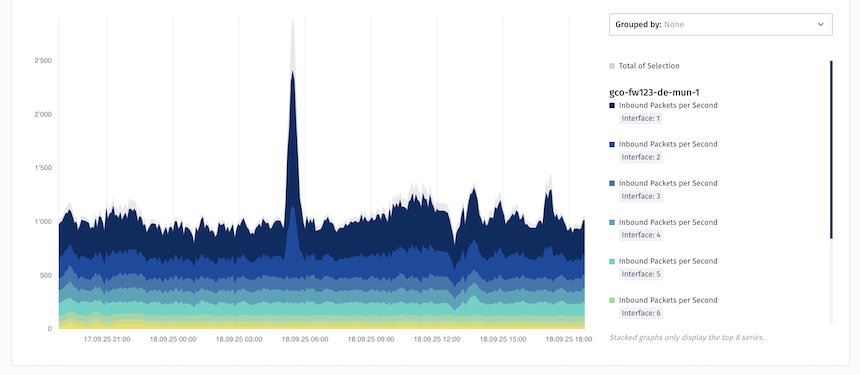
In the new world, an engineer opens the fleet view, compares today to yesterday, filters by region, and watches a pattern emerge – maybe a single DNS path, maybe a narrow set of IPs. They follow the trace and find the culprit: a dependency outside our perimeter, shifting behavior across the system. No finger-pointing. No hours lost. Just a clear answer, sensible mitigation, and time back for everyone.
Observability turns digging into discovery – faster, clearer, and aligned with the customer’s environment.
The Road Ahead
We’re not done – by design. Observability at Open Systems is a living project. We’re converging metrics with care, so dashboards and alerts remain rock-solid while we unify the plumbing. We’re deepening identity-centric correlation across ZTNA, Secure Web Gateway (SWG), VPN, and Firewall so we can support a user’s journey across contexts and troubleshoot experience, not just services. And because telemetry is most powerful when it shields customers, not just describes their world, we’re turning more insights into protective data products.
Every organization’s path to observability looks different. At Open Systems, ours started small: semantic conventions that made telemetry boringly consistent, cautious swaps of log scrapers, and eventually big moves like proxy and firewall logs. The takeaway isn’t the exact order we chose – it’s that OpenTelemetry is powerful enough to let you grow piece by piece, at a pace your organization can handle. Even a small change, like adopting common conventions, can be the spark that builds real observability maturity.
Done right, the transition is invisible to your users.
And that’s exactly the point.
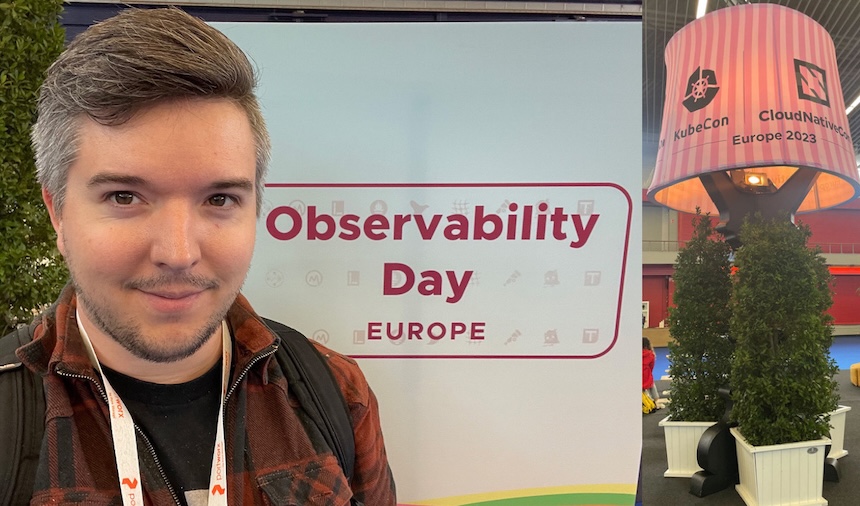
Want the deeper story? Check out my KubeCon Observability Day talk, where I dug into the challenges we faced – and the lessons we learned – when building up our observability stack!

Leave Complexity
Behind
To learn how Open Systems SASE Experience can benefit your organization, talk to a specialist today.
Contact Us